
EXPLORATORY ANALYSIS ON ENGLISH PREMIER LEAGUE 2022/2023
Analyzed the English Premier League 2022/2023 season, including data import, EDA, visualization, winning percentages, streak analysis, referee assessment, league table creation, and results display.

FAKE NEWS DETECTION USING PASSIVE CLASSIFIER
I developed a high-accuracy fake news detection system using supervised machine learning with a Passive-Aggressive classifier, while also conducting data collection and preprocessing, including web scraping and feature vector generation. This project involved system architecture and design for an effective Fake News Detection.

NETFLIX INTERACTIVE DASHBOARD WITH USE OF POWERBI
I retrieved a dataset from Kaggle, imported it into Power BI, and then performed data transformation and cleaning to address any data inconsistencies. Afterwards, I extracted the delimiter from the relevant data and utilized various DAX functions to achieve this. Finally, I created a suitable chart to effectively visualize the data.
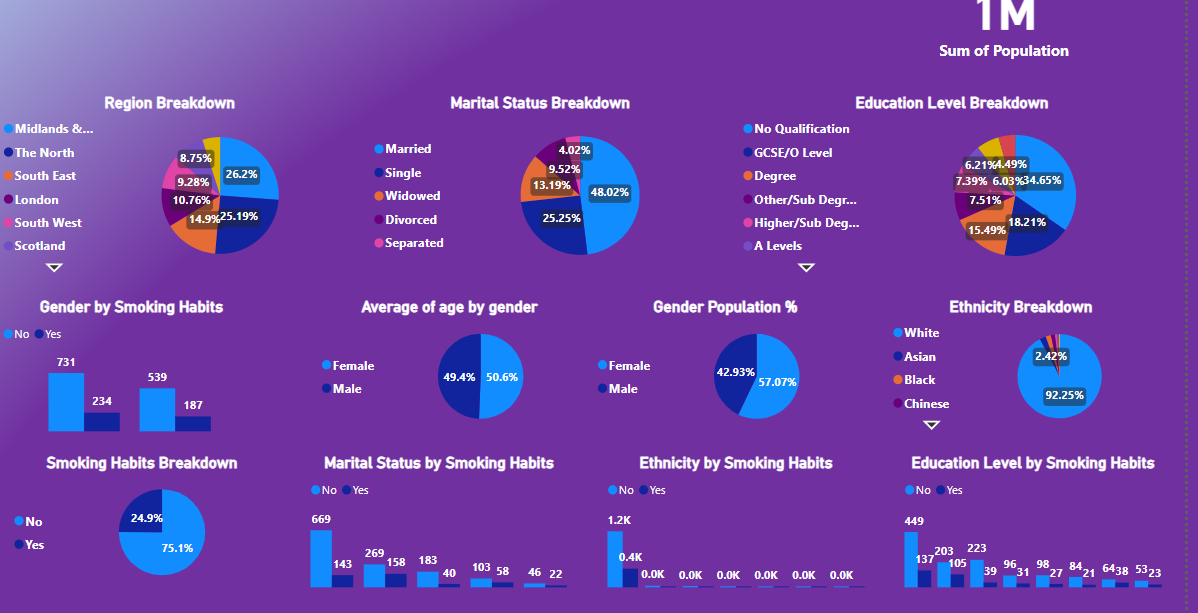
Smoking Dataset in UK
The Power BI report examines a UK smoking dataset that closely resembles the UK adult population. It shows a slight gender imbalance, with most participants being married or single, having diverse education levels, and being predominantly White. Importantly, a significant majority of the sample are non-smokers, highlighting the need to consider sample composition when interpreting smoking behavior data.
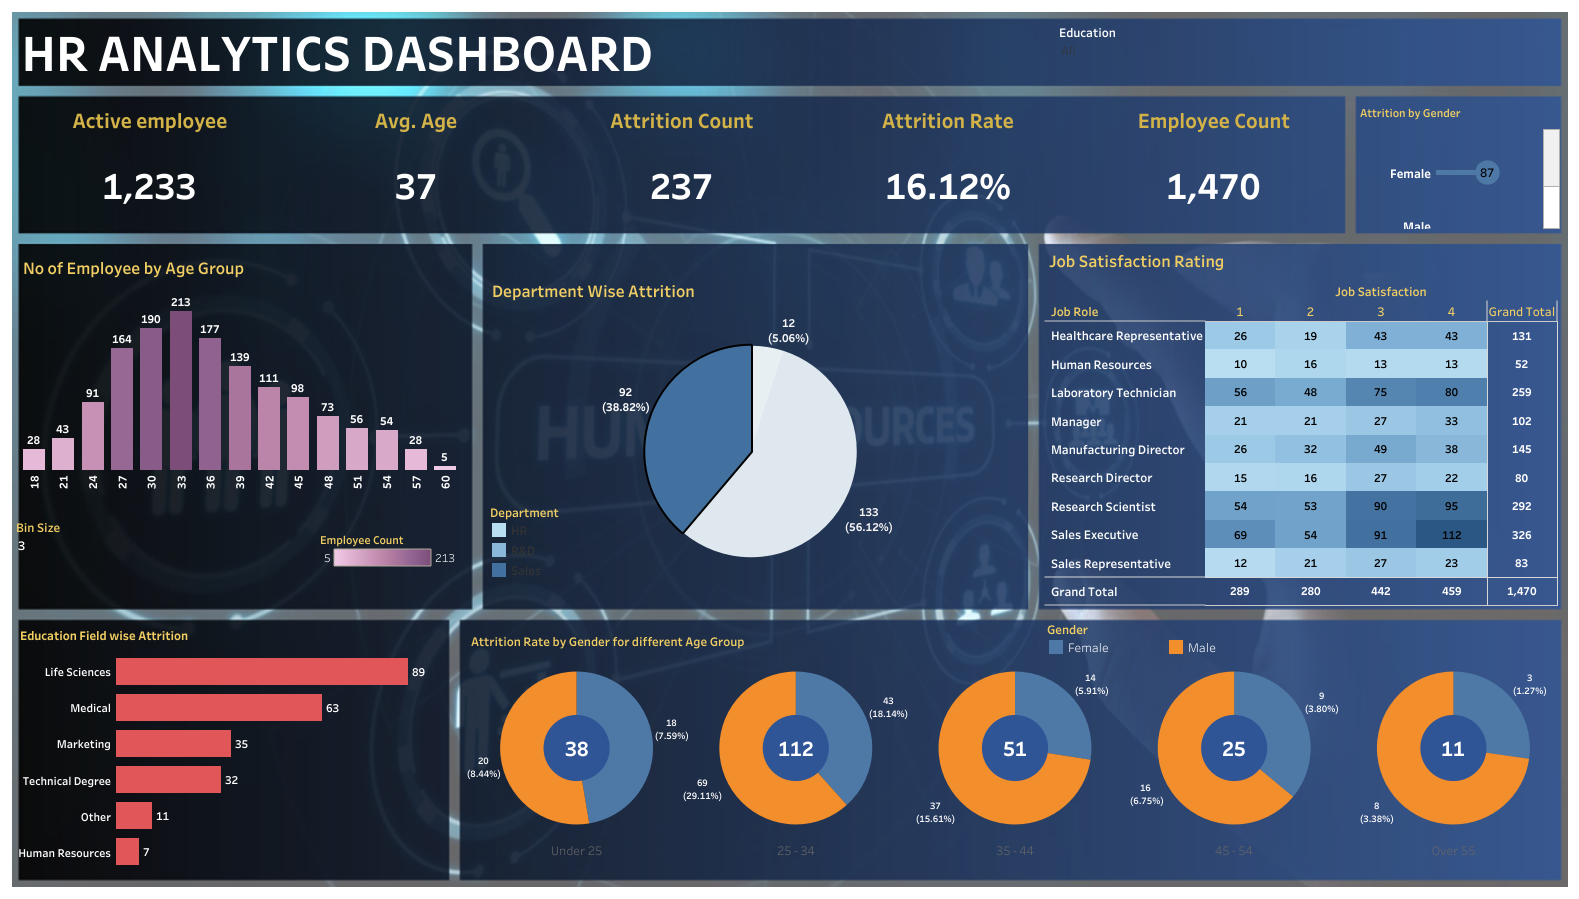
HR ANALYTICS DASHBOARD
I employed Tableau software to examine the HR dataset, generating multiple calculated columns utilizing various formulae. Additionally, I implemented a formula to set the bin size for my bar chart, enabling it to increase by one each time. To make it easily comprehensible to non-technical stakeholders, I utilized appropriate charts to visualize the data, which require no further explanations
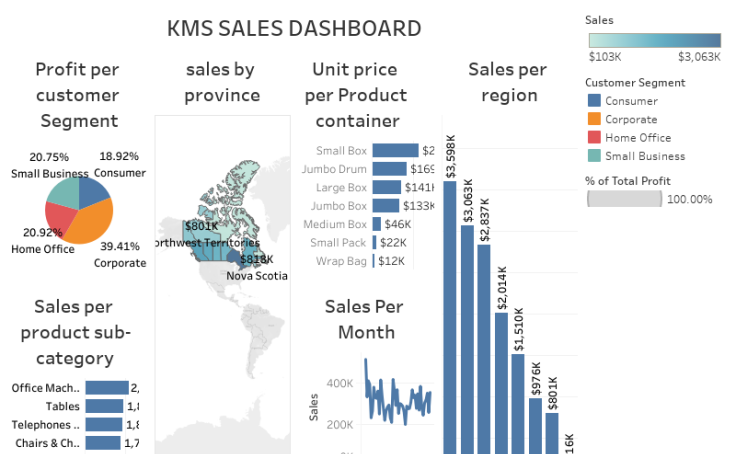
KMS SALE DASHBOARD WITH THE USE OF POWERBI
This is a sample of my Power BI dashboard created during bootcamp with lighthall.co bootcamp
NETFLIX DASHBOARD WITH THE USE OF TABLEAU
I obtained the data from Kaggle website and imported it into Tableau. Subsequently, I generated distinct worksheets to visualize the data and had to create a dashboard to display these worksheets.
KMS SUPERSTORE DATASET USE OF TABLEAU
This is a sample of my Tableau dashboard created during bootcamp with lighthall.co bootcamp
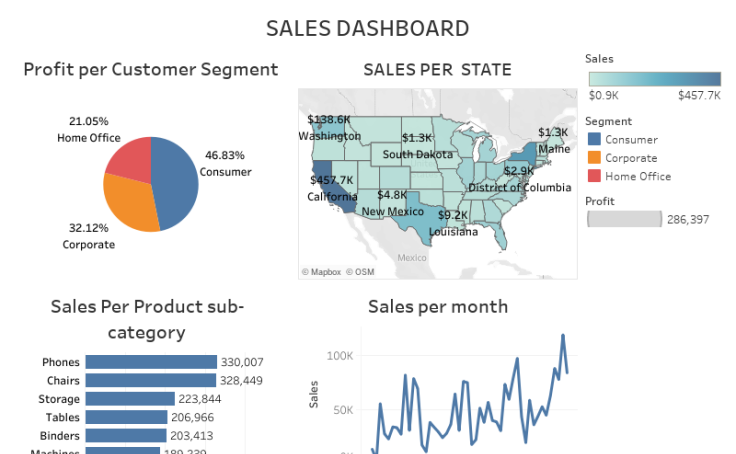
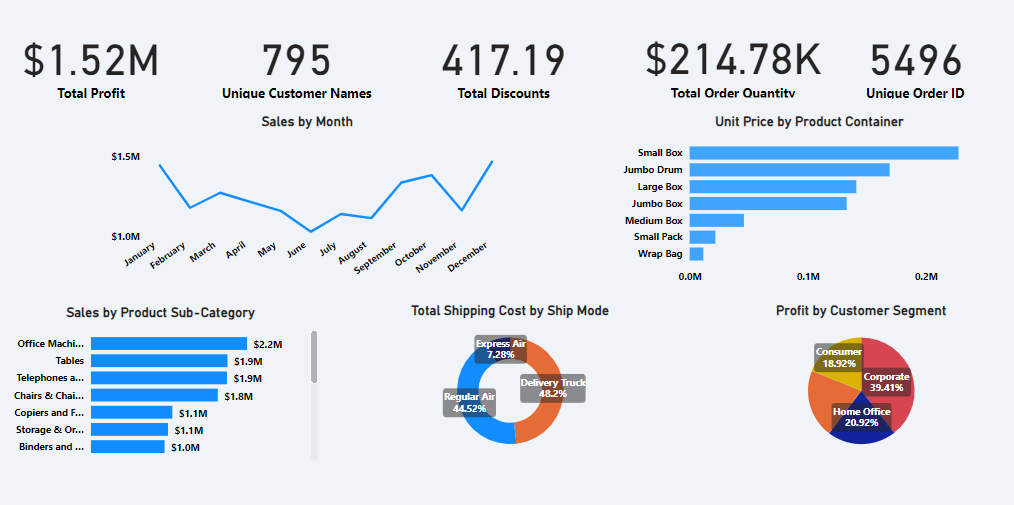
SALES DASHBOARD WITH THE USE OF TABLEAU
This is a sample of my Tableau dashboard created during bootcamp with lighthall.co bootcamp
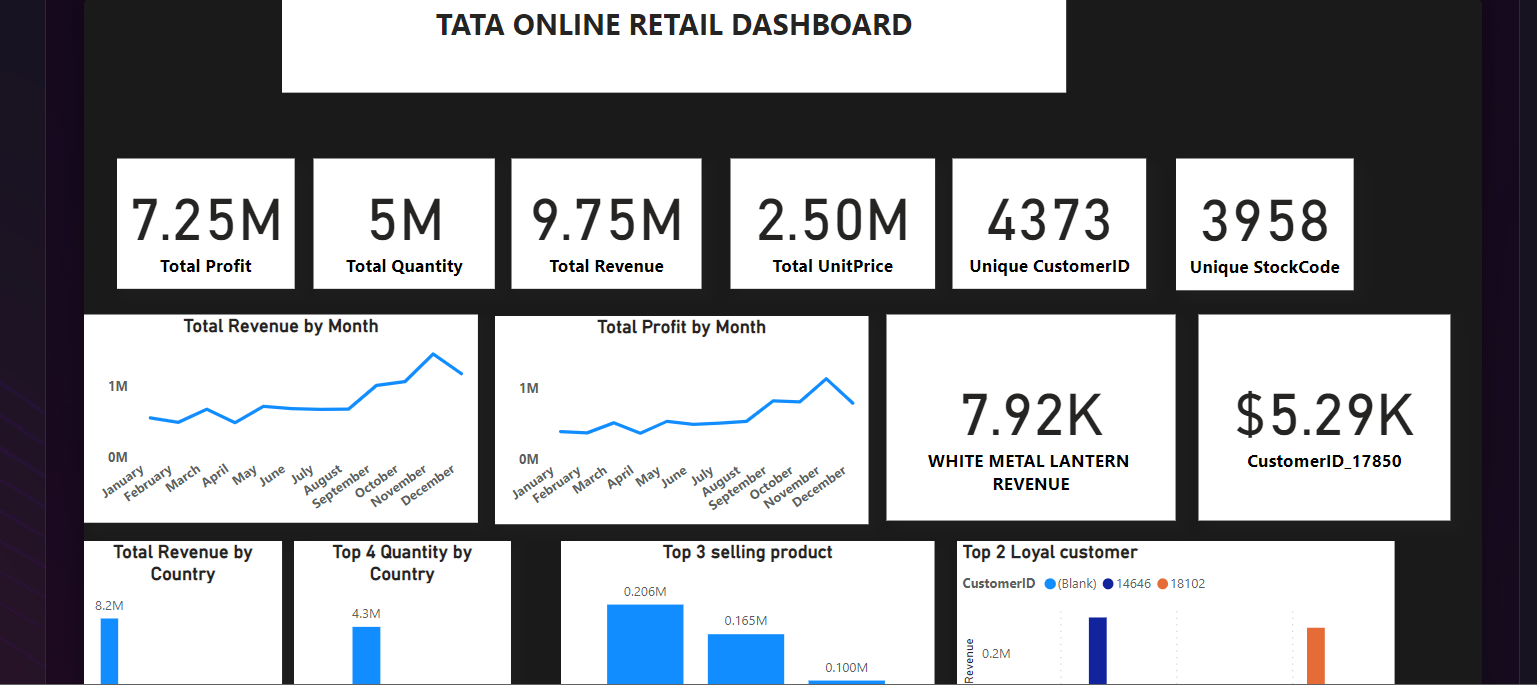
TATA ONLINE RETAIL WITH USE OF POWERBI
This is a PowerBI dashboard I created using the dataset for Tata online sales, showing information/insights that would be helpful in guiding future sales.

IMDB DATA FROM 2006 TO 2016 DASHBOARD
I attempted to verify the cleanliness of our data, and subsequently imported it into Power BI. I also utilized DAX functions to establish new measures for Total Revenue and Total Votes. Finally, I employed suitable charts to visualize all of our data.

PWC CALL CENTER TREND ANALYSIS DASHBOARD

Amazon Sales Dashboard
I obtained the data from Kaggle website and discovered that it was unorganized. To clean the data, I utilized Python libraries in Jupyter notebook, and subsequently imported the cleaned data to Tableau for visualization purposes..

Covid Cases and Deaths WorldWide DASHBOARD
I retrieved a dataset from Kaggle, imported it into tableau, and then performed data transformation and cleaning to address any data inconsistencies.